
Introduction
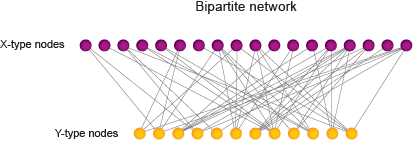
Biological processes are orchestrated through complex interaction networks that dictate how organisms develop, maintain homeostasis, respond to environmental cues and reproduce. Networks are modeled into graphs that depict interactions (‘edges’) between biological entities such as genes, tissues, proteins and metabolites (‘nodes’). If only one type of node is involved, as in protein-protein or genetic interaction networks, the graph is defined as monopartite. Bipartite graphs, on the other hand, describe interactions between two different types of nodes (X-type and Y-type). These include gene regulatory networks connecting transcription factors and target genes, phenotypic networks connecting genes and phenotypes, and expression networks connecting genes and tissues.
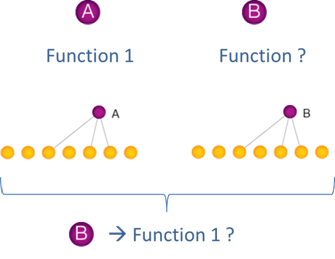
Networks have provided powerful tools for gene function annotation. For instance, the ‘guilt-by-association’ principle postulates that if a node with unknown function has similar interaction partners (hereafter referred to as ‘interaction profile’) as a node with a known function, the first node may have that function as well.
While seemingly intuitive, it is not trivial to know how to best capture interaction profile similarity between two (or more) nodes, as numerous metrics, known as association indices, can be used, and because each index can provide different values and rank similarity between pairs of nodes in a different order. Thus, it can be daunting for a biologist to select the most appropriate index for a particular goal. Here we provide an overview of association indices that are commonly used in genomics and systems biology, and provide a set of guidelines for association index selection based on different applications.
Types of association indices
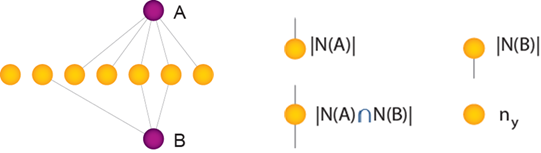
This guide and GAIN are focused on bipartite networks where association indices measure shared Y-type nodes between two X-type nodes A and B, in relation to their total number of interactions (‘node degree’), |N(A)| and |N(B)|, and the total number of Y-type nodes in the network (ny).
There are three main types of indices that are available in GAIN, each of which utilizes these variables in a different way.
Similarity indices
Similarity indices reflect the proportion of overlap and only consider the number of shared interactions between two X-type nodes A and B, and their individual degrees, and do not take the total number of Y-type nodes in the network into account. The value for the indices mentioned below range from 0 (no overlap) to 1 (perfect overlap).
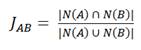
The Jaccard index represents the proportion of shared nodes between A and B relative to the total number of nodes connected to both X-type nodes.
The Simpson index considers the number of shared Y-type nodes between A and B relative to their smallest degree.
![]()
The Geometric index calculates the square of overlap in Y-type nodes, divided by the product of their individual degrees.
![]()
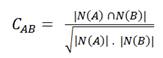
The Cosine index corresponds to the square root of the Geometric index.
Statistic-based indices
Statistic-based indices are based on probability distributions (Chi-square, Fisher’s exact test, etc.) and consider the likelihood of observing certain overlap between the interaction profiles of two X-type nodes given their degree and the total number of Y-type nodes in the network.
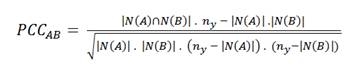
The Pearson correlation coefficient (PCC) that was originally developed to measure the linear relationship between two continuous variables. When employed on bipartite networks where interactions are either present or absent, it provides a value between -1 and 1 that describes how well the interactions between A and B overlap. A PCC of 1 indicates a perfect overlap, 0 corresponds to the number of shared interactors expected by chance and -1 depicts perfect anti-correlation.
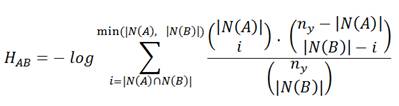
The Hypergeometric index quantifies the log-transformed probability of observing an equal or greater number of shared nodes than expected by chance, and therefore measures the significance of the overlap. The values for this index range from 0 (no overlap) to a number that depends on ny (it can be greater than 1).
Connection Specificity Index (CSI)
The indices mentioned above only consider the similarity in interacting partners between two X-type nodes without taking the connectivity of the Y-type nodes into account. In other words, the indices do not consider the specificity of the interactions. There are two issues relating to interaction specificity that need to be considered. First, Y-type nodes that are disproportionally highly connected (hubs) may confer artificially high levels of interaction profile similarity for X-type nodes with a low overall degree. Second, shared connections to Y-type nodes that are related do not provide an independent measure and may therefore also confer exaggerated levels of interaction profile similarity. For instance, in a gene-to-tissue expression network, neurons may be subdivided according to anatomy. Different types of neurons express many common, pan-neuronal, genes. As a result, a gene may be connected to many types of neurons, which can artificially increase their similarity to other neuronally expressed genes compared to the similarity between non-neuronal genes. The Connection Specificity Index (CSI) provides a context-dependent measure that mitigates the effect of non-specific interactions by ranking the significance of similarity between two X-type nodes according to the specificity of their shared interaction partners (Cell. 2011 Apr 29;145(3):470-82). CSI is defined as the fraction of X-type nodes that have an interaction profile similarity with A and B that is lower than the interaction profile similarity between A and B itself.
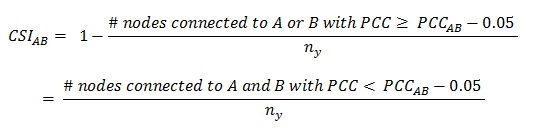
As originally defined, CSI employs the PCC as a first level index to rank the similarity between nodes, and uses a constant of 0.05 to define the lower boundary of node-pair similarity. When the constant is increased, CSI provides a more stringent measure. It is important to note that, in addition to PCC, other association indices may also be used for a first level ranking of interaction profile similarity.
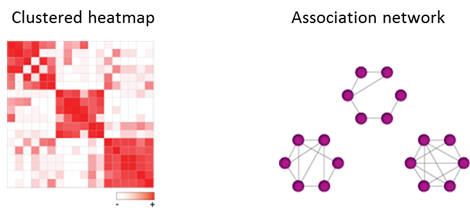
Finding modules
Modules are network neighborhoods comprised of multiple nodes with similar interaction profiles and can point to functional relationships. Modules can be identified by calculating association indices for all pairwise combinations of one type of node in the ‘Find Modules’ section, followed by clustering the indices into a heatmap or association network. Association networks only consist of one type of node (either X or Y-type). In such networks an edge is drawn between two nodes when their interaction profile similarity exceeds a selected threshold. This threshold can be selected by the user.
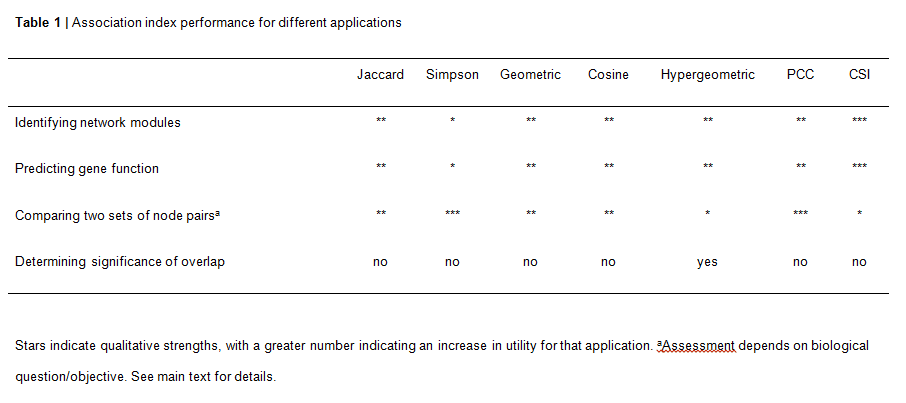
The association indices can perform differently in different types of networks and even within a network. CSI is the most suitable index for the identification of modules in networks that are characterized by the presence of Y-type hubs, or when the network harbors related Y-type nodes. This is because CSI considers the connectivity of the entire network in a context-dependent manner and levels the similarity between different modules. However, a disadvantage of using CSI is that it may distort the organization of the underlying system, for instance when it contains some modules comprised of nodes with high overall levels of similarity and other modules with lower levels of node-pair similarity. Where available, it is recommended that researchers integrate the association index results with other types of functional information to assess optimal performance.
Network integration
Individual networks do not function in isolation. Rather, they interact together in a ‘network of networks’ to orchestrate the development and functionality of biological systems. The integration of different types of networks enables the comparison of node-pairs across networks, and has therefore become a primary objective in systems biology. Questions that can be answered include whether directly interacting pairs of nodes in one network also tend to interact in another, whether pairs of nodes that are highly similar in one network are also similar in another, or a combination of the two. An example of the first type of question is whether physically interacting proteins also interact genetically. An example of the second type of question is whether transcription factors that regulate a shared set of target genes are expressed in the same tissues and/or under the same conditions. Finally, an example of the third question is whether proteins that physically interact tend to share phenotypes.
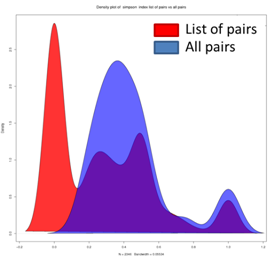
This type of analysis can be performed in the ‘Compare Similarity’ section where a user can compare the distribution of index values between a selected list of node-pairs and all possible pairs (multiple lists can be analyzed and downloaded individually to compare them using statistical analysis programs).
When the main goal is to compare the similarity between node pairs, the biological question should drive index selection. For instance, the Simpson index may be used to avoid penalizing large differences in node degree as the maximum similarity is expected when the interactors of one node are included in the set of interactors of the other node. Conversely, if one wants to capture this difference in node degree, other indices such as Jaccard, Cosine, Geometric and PCC are more appropriate. The Jaccard and Cosine index have a more intuitive formula and do not repress low overlaps as much as the Geometric index. If a researcher is interested in identifying anti-correlation as well as similarity, the PCC should be employed. The Hypergeometric index should be used with caution to determine the magnitude of similarity between interaction profiles as it does not scale linearly with the proportion of overlap. However, only this index is suited to calculate the statistical significance of interaction profile overlap.
Although GAIN in primarily designed to analyze bipartite networks, association indices may also be employed to analyze monopartite networks, for instance to determine the extent to which paralogous proteins share interaction partners. Additionally, the PCC and the Cosine indices may also be applied to determine profile similarity in weighted, non-binary networks such as co-expression networks.